| Index of papers | Phil Gyford: web | email |
| Fall 1999 | |||||
| Futures Methods I | |||||
| Time Series Report | PDF version | 1999-12-01 | |||
|
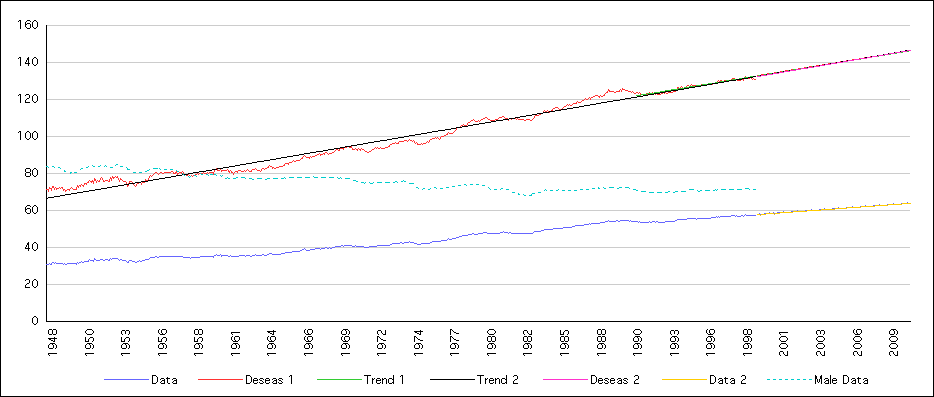
[Comment: A very boring, straight graph to extrapolate. But I guess that makes it easier.] The percentage of women in the US civilian workforce Since 1948 the percentage of women who are at work has increased at a remarkably steady rate, from 30.9% to 57.2% in September 1999. While there are several small peaks and troughs in the progress, we can see from the chart (the 'Data' line) that it's not too far from a straight line. The few irregularities would seem to be due to fluctuations in the labour market as a whole, rather than factors particularly affecting the female workforce; if we compare the data to the percentage of men in the workforce ('Male Data') we can see that the irregularities are echoed there. Incidentally, the percentage of men has decreased at a fairly steady rate over the same period, from 83.8% to 71.6%. Taking the average figure for each month, we can see there is a very slight amount of seasonality in the data: On average there have been more women at work in the summer (peaking at 43.8% in September) compared to the winter months (a low of 43.4% in January). This indicates the seasonal nature of many jobs, from agriculture to tourism, also indicated by the slight rise in November and December, the holiday season. While these are only small differences (I expected to find more change), I deseasonalized the data to remove these slight fluctuations: dividing each data point by its corresponding seasonal average and multiplying by 100 creates a deseasonalized index of the data which is used through the following process. The deseasonalizing also has the effect of amplifying the data, which lets us see the discontinuities more clearly in the graph. While there are deviations in its steady rise, there appears to be little in the way of short-term error, so there is no reason to smooth the data. Next I measured the linear trend. Given that the dataset is from such a long period, during which many factors will have changed, I decided to use only the last few years to determine the trend. Between 1983 and 1991 there was a peak in the percentage of women employed, after which the rate of increase has remained steady. Assuming the cause of this 'bubble' has now passed, I used the data from 1991 to 1999 for this first measurement of the trend ('Trend 1' on the graph). I calculated the regression parameters for these years, giving a monthly increase of 0.102 on a line which would cross the y-axis at 69.343. After using these figures to calculate trend values for each month, the deviation of the data from the trend is found by subtracting one from the other. I averaged the final three years of the deviation, assuming this would be a suitable length of time to account for any extremely short term errors. I projected the trend ahead through to 2010, and subtracting the average deviation from these figures gives us a projection of the deseasonalized data ('Deseas 1'). Multiplying each of these figures by its seasonal average and dividing by 100 gives us a reseasonalized projection of the original data ('Data' again). As might be expected by using eight years of steady increase for the sample data, the extrapolation rises steadily, giving us 64% of women at work by the end of 2010. I wondered whether the result would be different using the entire dataset, rather than relying on only the previous eight years, and calculated the forecast again ('Trend 2,' 'Deseas 2,' 'Data 2'). There was very little difference in this compared with the first iteration, indicating how steady the rate of increase has been over fifty years; this version gives us 63.9% of women at work in ten years time. (Click graph for larger version.)
|
|
| Index of papers | Phil Gyford: web | email |